

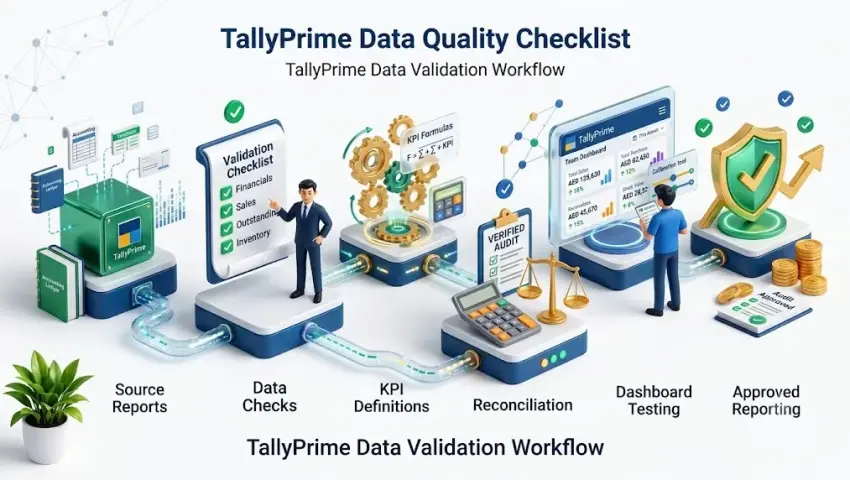
TallyPrime Data Validation: 10 Checks for Better MIS
 By Pragyantra
- Tally Solutions
- Oct 16, 2026
- 15 minutes read
- 7 Views
Before You Build a TallyPrime Dashboard: 10 Data Quality Checks for Reliable Business Reports
A business dashboard can make accounting information easier to understand, but the quality of its insights depends on the quality of the underlying data. If customer balances are inconsistent, stock classifications are incomplete or reporting periods are not aligned, even a well-designed dashboard can present a misleading picture.
For businesses using TallyPrime, preparing the data and defining reporting rules are important steps before automating management information system (MIS) reports.
This guide explains ten practical data quality checks that business owners, accountants and finance teams can perform before connecting TallyPrime data to a dashboard or another reporting platform.
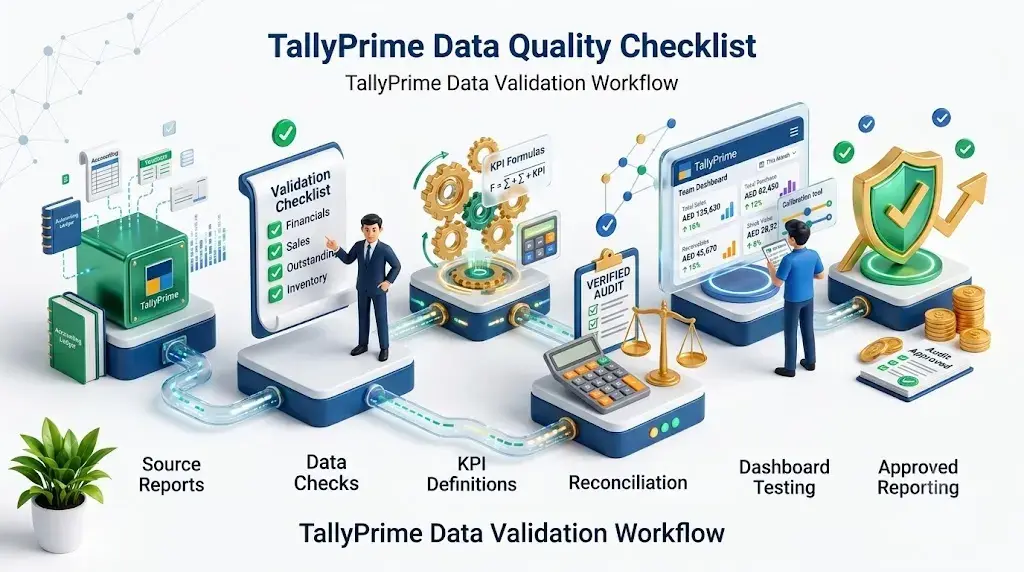
Quick Answer: How Do You Prepare TallyPrime Data for Accurate Business Reporting?
Start by checking the accuracy of opening balances, ledger classifications, voucher entries, outstanding bills, inventory masters, stock units, reporting periods, company or branch mappings, KPI definitions and reconciliation procedures.
Document the rules for each metric and compare sample dashboard results with the corresponding source reports before relying on them for management decisions.
The objective is not to make every record perfect before starting a project. It is to identify material issues, define acceptable data rules and establish a process for validating reports.
Why Data Quality Matters Before Building a Dashboard
TallyPrime records accounting transactions and supports business reporting. A dashboard adds a management-oriented view by organizing selected information into indicators, charts, comparisons and summaries.
However, these two layers serve different purposes.
The accounting system records transactions according to the configured accounting structure. The reporting layer interprets selected data according to defined business rules.
For example, a management dashboard might display monthly sales, outstanding receivables and stock value. Before those figures can be trusted, the business must establish which transactions belong in each metric, which period should be used and how exceptions should be handled.
Common issues include:
- Similar ledger names being used for different purposes
- Incomplete or inconsistent stock-item classifications
- Outstanding balances that need reconciliation
- Transactions recorded in unexpected periods
- Different definitions of revenue or profit across reports
- Multiple company records requiring consistent consolidation rules
A dashboard can help reveal these issues, but it should not silently hide them or treat every source value as correct.
1. Check Ledger Groups and Account Classifications
Ledger classification affects how accounting information appears in reports. If ledgers are placed under unsuitable groups or similar accounts are maintained inconsistently, management summaries may become difficult to interpret.
What should you review?
- Whether ledgers are assigned to appropriate groups
- Whether duplicate or confusing ledger names exist
- Whether customer and supplier accounts follow a consistent naming approach
- Whether expense and income classifications support the required reporting
- Whether inactive or obsolete ledgers need review
Practical example
Suppose a business records freight expenses under several different ledger names. A manager reviewing one expense category may not see the complete picture without consolidating those records correctly.
The solution is not necessarily to rename every ledger. First, establish the intended classification and determine how the existing records should be handled.
Reporting tip: Document any grouping or mapping rules used by the dashboard so the finance team can understand how individual ledgers contribute to a summary.
2. Verify Opening Balances and Financial Reconciliation
Opening balances and unreconciled differences can affect the interpretation of financial reports. Before using dashboard figures for decisions, establish whether the relevant source balances have been reviewed.
Checks to perform
- Review opening balances for relevant ledgers
- Investigate unexplained differences between expected and recorded balances
- Review bank reconciliation status where applicable
- Check relevant receivable and payable balances against supporting records
- Confirm that period-end adjustments have been considered
The exact checks depend on the business, accounting period and reporting requirements.
A dashboard should not be treated as a replacement for accounting reconciliation. Its role is to present selected information in a useful form, while accounting teams remain responsible for reviewing and correcting the underlying records.
What should be documented?
Record the source report, reporting date, difference identified, responsible reviewer and resolution status for material discrepancies.
This creates a repeatable process rather than relying on someone to remember which numbers require further investigation.
3. Review Voucher Entries and Transaction Dates
Transaction-level issues can affect daily, weekly and monthly comparisons. A report may appear inconsistent simply because a transaction was recorded in a different period from the one management expects.
Review these areas
- Voucher dates and the intended reporting period
- Duplicate entries or repeated imports
- Cancelled, reversed or amended transactions
- Unusual values that require investigation
- Missing supporting information for material transactions
- Transactions entered after a period was reviewed
Do not automatically classify every unusual transaction as an error. Some entries may be legitimate adjustments, returns, corrections or exceptional business events.
Instead, define review rules that help the accounts team distinguish normal transactions from records requiring attention.
Why this matters for dashboards
If one report uses the voucher date while another uses a different date or filtering rule, their totals may not match. The dashboard specification should clearly state the date basis used for each metric.
4. Validate Customer and Supplier Outstanding Balances
Outstanding balances are particularly important when management uses reporting to plan collections, monitor overdue accounts or review payment obligations.
Questions to ask
- Are customer and supplier balances reviewed against the relevant source reports?
- Are bill-wise details maintained where the business requires them?
- Are advances, credit notes and adjustments handled consistently?
- Are ageing categories defined clearly?
- Is the reporting date visible on the report?
- Are disputed balances or unusual items identifiable for review?
Define the ageing rules
An ageing report might group balances into categories such as:
- Not yet due
- 1–30 days overdue
- 31–60 days overdue
- More than 60 days overdue
These are example categories, not mandatory rules. The business should choose categories appropriate to its collection policy and clearly define the date from which overdue days are calculated.
A dashboard should also explain whether it displays outstanding amounts as of the current date, a selected historical date or the latest available data refresh.
This prevents managers from comparing figures that use different dates or assumptions.
5. Check Stock Item Masters and Inventory Units
Inventory reporting depends on consistent stock-item information. Businesses with many products, units of measurement or storage locations should review their master data before creating inventory dashboards.
Inventory data checklist
- Are stock-item names and codes consistent?
- Are units of measurement configured correctly?
- Are relevant stock groups and categories maintained?
- Are godowns or locations configured as required?
- Are opening quantities and values reviewed?
- Are negative stock situations investigated where relevant?
- Are stock valuation methods understood by the reporting team?
Example
A distributor may maintain the same product under slightly different names across its records. If the reporting layer treats these as separate items, the resulting product-level summary may not represent the complete position.
The appropriate correction depends on the source records and business requirements. Master data should be reviewed before deciding whether items need consolidation or mapping.
Important distinction
Stock quantity, stock value and stock movement are different measures. A dashboard should not combine them without explaining the calculation and valuation basis.
6. Define Each KPI Before Automating Reports
One of the most important preparation steps is agreeing on what each business metric means.
Terms such as sales, gross profit, net profit, collections and outstanding amounts can have different interpretations depending on the business and reporting objective.
For example, management may want sales figures excluding returns, a particular set of taxes or selected transaction types. The intended calculation should be documented before the dashboard is built.
Create a KPI definition sheet
| KPI | What must be defined |
|---|---|
| Sales | Included transaction types, date basis and treatment of returns |
| Gross profit | Revenue and cost calculation rules |
| Outstanding receivables | Included balances and reporting date |
| Collection performance | How receipts are linked to outstanding amounts |
| Stock value | Valuation basis and included inventory |
| Sales growth | Comparison periods and percentage calculation |
The table is a starting point. The final definitions should reflect the company's accounting policies and management requirements.
Why definitions matter
If two teams calculate the same KPI differently, their reports may disagree even when both are using valid source data.
A written KPI dictionary helps prevent this problem and gives developers and finance teams a common reference during implementation and testing.
7. Standardize Reporting Periods and Filters
A report for the current month should not be compared with a different period without making the distinction clear.
Similarly, a dashboard showing one company, location or stock group should not be interpreted as a complete business summary unless the intended scope is clear.
Establish consistent rules for:
- Financial year and reporting period
- Start and end dates
- Company or branch selection
- Customer, supplier or stock-item filters
- Currency presentation where applicable
- Treatment of incomplete or late-arriving records
Make filters visible wherever possible. A user should be able to understand what a chart includes without having to guess.
For period comparisons, document whether the periods are complete, partial or based on the latest available information.
8. Check Company, Branch and Data Mapping Rules
Businesses operating multiple companies or locations may need a combined management view. However, consolidation requires more than adding figures together.
Before combining data, confirm that the records are comparable and that the reporting scope is defined.
Review these points
- Which companies or branches should be included?
- Are the reporting periods aligned?
- Are similar ledger and stock classifications mapped consistently?
- Are inter-company transactions handled appropriately?
- Are currency differences relevant?
- Should users see consolidated figures, individual company figures or both?
Example
Two companies may use different ledger structures for similar expenses. A consolidated dashboard needs a clear mapping rule before it can present a meaningful combined figure.
Where the source data does not support a reliable comparison, show the limitation rather than assuming that the records are equivalent.
The technical implementation must also confirm how each company’s data can be accessed and whether the proposed reporting setup supports the required structure.
9. Confirm Data Access, Refresh Frequency and Permissions
A dashboard is useful only when users understand how current its information is and what data they are permitted to see.
These requirements should be discussed before implementation.
Questions to resolve
- Which source reports or fields are required?
- How will the data be retrieved?
- How frequently should the dashboard refresh?
- What happens if a refresh fails?
- Who can access financial or operational information?
- Are different views required for different roles?
- How will data discrepancies be investigated?
Do not promise real-time updates until the proposed connection and refresh method have been confirmed.
Likewise, do not assume that all users should have access to every company, ledger or financial metric.
Permissions, authentication, storage and data retention should be reviewed according to the selected architecture and the business's security requirements.
10. Reconcile Dashboard Outputs Before Go-Live
A dashboard should be tested against its source reports before management begins relying on it.
Testing should cover both normal reporting scenarios and relevant exceptions.
A practical validation process
Step 1: Select a reporting period
Choose a period for which the source data and relevant reports are available.
Step 2: Select representative metrics
Include important measures such as sales, outstanding balances, stock values and other agreed KPIs.
Step 3: Compare source and dashboard results
Check that the same reporting dates, filters and calculation rules are being used.
Step 4: Investigate differences
Classify each difference as a data issue, mapping issue, calculation issue, timing difference or expected exception.
Step 5: Correct and retest
Resolve confirmed problems and repeat the comparison.
Step 6: Obtain business approval
Ask the appropriate finance or management reviewer to approve the definitions and results before operational use.
The acceptable tolerance for differences depends on the metric and business requirements. Some values may require exact agreement, while others may involve documented timing or rounding differences.
Reporting Readiness Checklist
💡 A Note on Prioritization
Not every business needs the same level of preparation. Prioritize the checks that affect the intended dashboard and expand the checklist as reporting requirements become clearer.
📥 Want to Save This Checklist?
Get a printable PDF version of this readiness checklist to share with your finance team or dashboard partner.
How Pragyantra Helps You Get Ready
Our team works alongside your finance department to review every checkpoint on this list before we begin building your TallyPrime dashboard. That way, your KPI definitions are grounded in clean, verified data — not guesswork.
If any of the checklist items raise questions, our specialists will help you audit the relevant TallyPrime records, reconcile discrepancies, and standardize reporting rules before the technical work begins.
Explore Related Services
Tally Customization (TDL)
Custom voucher fields, approval rules, and validated data capture.
Learn MoreCommon Mistakes to Avoid
Building charts before defining the metrics
An attractive visualization cannot resolve ambiguity about what a number represents. Define the KPI first.
Assuming every difference is a software error
Differences can arise from reporting dates, filters, accounting adjustments, data mappings or calculation rules. Investigate the cause before changing the system.
Combining companies without a mapping plan
Consolidated reporting requires consistent definitions and an agreed treatment of differences between companies.
Treating a dashboard as an accounting correction tool
A dashboard can help identify unusual figures, but the relevant accounting records must be reviewed and corrected through the appropriate process.
Promising real-time reporting without checking the architecture
Data availability depends on the selected connection, refresh process and source environment. Confirm these details before setting expectations.
Skipping user acceptance testing
A dashboard may be technically functional but still fail to answer the questions management needs to ask. Test it with actual reporting scenarios and intended users.
How a Business Dashboard Fits into the Reporting Process
Once the relevant data checks and KPI definitions are established, the reporting workflow can be planned around the business's requirements.
A typical process is:
TallyPrime source data → Data extraction or integration → Validation and KPI rules → Dashboard views → Management review
Additional business systems may be included when required and technically supported.
The dashboard can present selected information in a more accessible format, while TallyPrime remains part of the underlying accounting workflow. The exact architecture depends on the required data sources, reporting scope and access requirements.
For businesses planning this next step, Pragyantra's AI Business Dashboard for TallyPrimepage explains the relevant service offering. The scope should be finalized after reviewing the business's reporting needs and available data.
Frequently Asked Questions
Why should TallyPrime data be validated before building a dashboard?
Data validation helps identify classification issues, inconsistent reporting rules, unexplained differences and missing information before those issues affect management reports.
Does a dashboard automatically correct accounting errors?
No. A dashboard can help surface discrepancies, but accounting records must be investigated and corrected through the appropriate accounting process.
Which TallyPrime reports should be checked first?
Start with the reports needed for the planned dashboard. Common examples include sales, receivables, payables, inventory and financial summaries. The exact list depends on the business's reporting requirements.
Can a dashboard combine multiple TallyPrime companies?
It may be possible, depending on the source setup, access method and consolidation requirements. Ledger mapping, reporting periods and calculation rules should be reviewed first.
How do I make TallyPrime MIS reports consistent?
Define the reporting period, filters, KPI formulas, transaction inclusion rules and data validation procedure. Document those rules so the same metric is interpreted consistently across reports.
How often should dashboard data be validated?
Validation should take place during implementation and whenever material changes affect data sources, mappings or calculations. Ongoing checks should be appropriate to the business's reporting risk and update frequency.
Can Excel data be included in business reporting?
It may be possible to incorporate Excel data if the format, ownership, data quality and connection method are suitable. The team should define which source is authoritative when values conflict.
What should I prepare before requesting a TallyPrime dashboard?
Prepare a list of the reports you need, the KPIs management wants to monitor, the relevant companies or branches, any additional data sources and the desired refresh frequency. Existing sample reports can help clarify the scope.
Conclusion
Reliable business reporting begins with clear definitions and dependable source data. Reviewing ledger classifications, reconciliations, inventory records, KPI formulas, reporting periods and data mappings gives a dashboard project a stronger foundation.
The goal is not to delay reporting until every historical issue has disappeared. It is to understand the important risks, document the rules and validate the outputs before using them for decisions.
If your business is planning to move from manually prepared reports to a structured management dashboard, start by identifying the metrics that matter and the checks needed to make those metrics meaningful.
Planning a dashboard for your business?
Explore Pragyantra's AI Business Dashboard for TallyPrimeand prepare your reporting requirements for a focused discussion.

Pragyantra
Leave a comment
Your email address will not be published. Required fields are marked *