



TallyPrime Excel Integration: Automate Data Exchange & Reporting
Excel is still one of the most widely used tools for business reporting.
Businesses use Excel for:
- Sales reports
- MIS
- Customer lists
- Inventory analysis
- Financial reporting
- Management reports
- Budgeting
- Data consolidation
At the same time, TallyPrime may be used for accounting, invoicing, inventory and financial transactions.
The problem begins when information has to be moved manually between the two systems.
An accountant may export data from TallyPrime, clean it in Excel, create formulas, prepare reports and then repeat the same process every day or month.
For businesses handling large amounts of information, this can become time-consuming.
TallyPrime Excel Integration can help create a structured workflow between TallyPrime and Excel so that relevant data can be transferred, processed or reported according to the business requirement.
The exact approach depends on the TallyPrime environment, Excel workflow, data structure and the type of automation required. Explore general Tally Integrationsolutions for connected business setups.
💡 Quick Answer: What Is TallyPrime Excel Integration?
TallyPrime Excel Integration means creating a workflow that allows relevant data to move between TallyPrime and Excel in a structured way.
Depending on the requirement, the workflow can involve:
TallyPrime → Excel
for reporting and analysis,
or:
Excel → TallyPrime
for selected structured data-entry workflows.
A more advanced architecture can also use an integration layer:
↓
Integration Layer
↓
Excel / Reporting System
The objective is to reduce unnecessary manual copy-paste work and create a more consistent data workflow.

Why Do Businesses Need TallyPrime and Excel Integration?
Excel is flexible, but manually moving large amounts of accounting data into spreadsheets can create operational challenges.
1. Repetitive Copy-Paste Work
Teams may repeatedly export, copy, clean and rearrange information.
2. Manual Reporting
Monthly MIS reports can require multiple steps before management receives the final report.
3. Formula Dependency
Complex spreadsheets may depend on formulas created and maintained manually.
4. Data Inconsistency
When information is copied across multiple files, different versions of the same data can appear.
5. Delayed Management Reports
If reports depend on manual consolidation, management may have to wait before receiving updated information.
6. Multiple Excel Files
Different departments may maintain separate spreadsheets, making consolidation difficult.
A structured TallyPrime-Excel workflow can reduce some of these problems.
How Does TallyPrime Excel Integration Work?
There is no single method that works for every business.
A basic workflow may look like:
For data going in the opposite direction:
For more customized workflows:
The correct approach depends on what the business actually needs to automate. Where customized programmatic pipelines are needed, explore our Tally API Integration Services.
What TallyPrime Data Can Be Used in Excel?
The exact data depends on the reporting or integration requirement.
Common examples include:
| TallyPrime Data | Possible Excel Use |
|---|---|
| Sales | Sales analysis |
| Purchases | Purchase reporting |
| Receivables | Outstanding analysis |
| Payables | Payable reports |
| Inventory | Stock analysis |
| Customers | Customer reporting |
| Products | Product performance |
| Expenses | Expense analysis |
| Profit & Loss | Management reporting |
| Branch Data | Branch comparison |
The objective should be to extract the information that is actually needed rather than moving unnecessary data.
TallyPrime Data to Excel
One common requirement is using TallyPrime data for Excel-based analysis.
For example:
Excel can then be used for:
- Filtering
- Sorting
- Calculations
- Pivot analysis
- Charts
- Comparisons
- Custom reporting
This can be useful when management has existing Excel-based reporting processes.
Excel to TallyPrime
The workflow can also work in the opposite direction.
Some businesses maintain structured information in Excel and may need to process that information within TallyPrime.
A conceptual workflow could be:
Before automating an Excel-to-TallyPrime workflow, it is important to define:
- Required fields
- Data formats
- Customer mapping
- Product mapping
- Transaction type
- Validation rules
- Duplicate handling
Not every Excel file is suitable for direct automated processing.
Why Data Mapping Is Important
Suppose Excel contains Customer Name while TallyPrime uses Ledger Name.
Similarly, Product Code may need to map to Stock Item.
A basic mapping table could look like:
| Excel Field | TallyPrime Field |
|---|---|
| Customer Name | Ledger / Customer |
| Product Code | Stock Item |
| Quantity | Quantity |
| Rate | Rate |
| Invoice Number | Voucher Reference |
| Date | Voucher Date |
| Amount | Transaction Amount |
The actual mapping depends on the business workflow.
A mapping document should ideally be prepared before automation is developed.
Excel-Based MIS Reporting with TallyPrime
One of the most common uses of TallyPrime data in Excel is MIS reporting.
For example:
A business may analyze:
- Daily sales
- Monthly sales
- Branch performance
- Product sales
- Customer sales
- Outstanding
- Expenses
- Profitability
- Sales trends
Excel can be particularly useful where management already has established reporting templates.
TallyPrime + Excel for Sales Reporting
A sales team or management team may need reports such as:
| KPI | Example |
|---|---|
| Total Sales | Daily / Monthly |
| Sales by Product | Product-wise |
| Sales by Customer | Customer-wise |
| Sales by Branch | Branch-wise |
| Sales Trend | Month-on-month |
| Outstanding | Customer-wise |
Instead of manually rebuilding these reports every time, a structured reporting workflow can make the process more repeatable.
TallyPrime + Excel for Inventory Reporting
Inventory teams can use relevant TallyPrime data in Excel for analysis such as:
- Stock levels
- Product movement
- Low-stock items
- Product-wise sales
- Warehouse comparisons
- Purchase vs sales
- Inventory trends
A typical reporting workflow:
The exact metrics should depend on the business's inventory process.
TallyPrime Excel Automation vs Manual Excel Reporting
| Manual Reporting | Structured Integration |
|---|---|
| Repeated export/import | Defined data workflow |
| Copy-paste | Automated or semi-automated transfer |
| Multiple files | Centralized reporting process |
| Repeated formatting | Standardized report structure |
| Higher manual dependency | Reduced repetitive work |
| More opportunities for manual errors | Validation can be introduced |
Automation does not mean Excel becomes unnecessary.
Instead, the goal can be to remove repetitive data preparation while retaining Excel for analysis where it is useful.
Can TallyPrime Data Be Used in Automated Dashboards?
Yes, depending on the technical architecture.
A business can create a broader reporting workflow:
Excel can also remain part of the reporting ecosystem:
↓
Data Layer
↙ ↘
Excel Dashboard
This allows different users to consume business information in different formats.
Pragyantra's centralized business dashboard approach similarly focuses on connecting business systems and using centralized data for management reporting. Learn more about our Business Intelligence Tools in Dubai & UAE.
TallyPrime Excel Integration for Different Businesses
Retail Businesses
Retailers can use TallyPrime data in Excel for:
- Sales analysis
- Product performance
- Inventory reporting
- Branch comparisons
Manufacturing Businesses
Manufacturers may use Excel reports for:
- Purchase analysis
- Production-related reporting
- Inventory
- Product costs
- Sales analysis
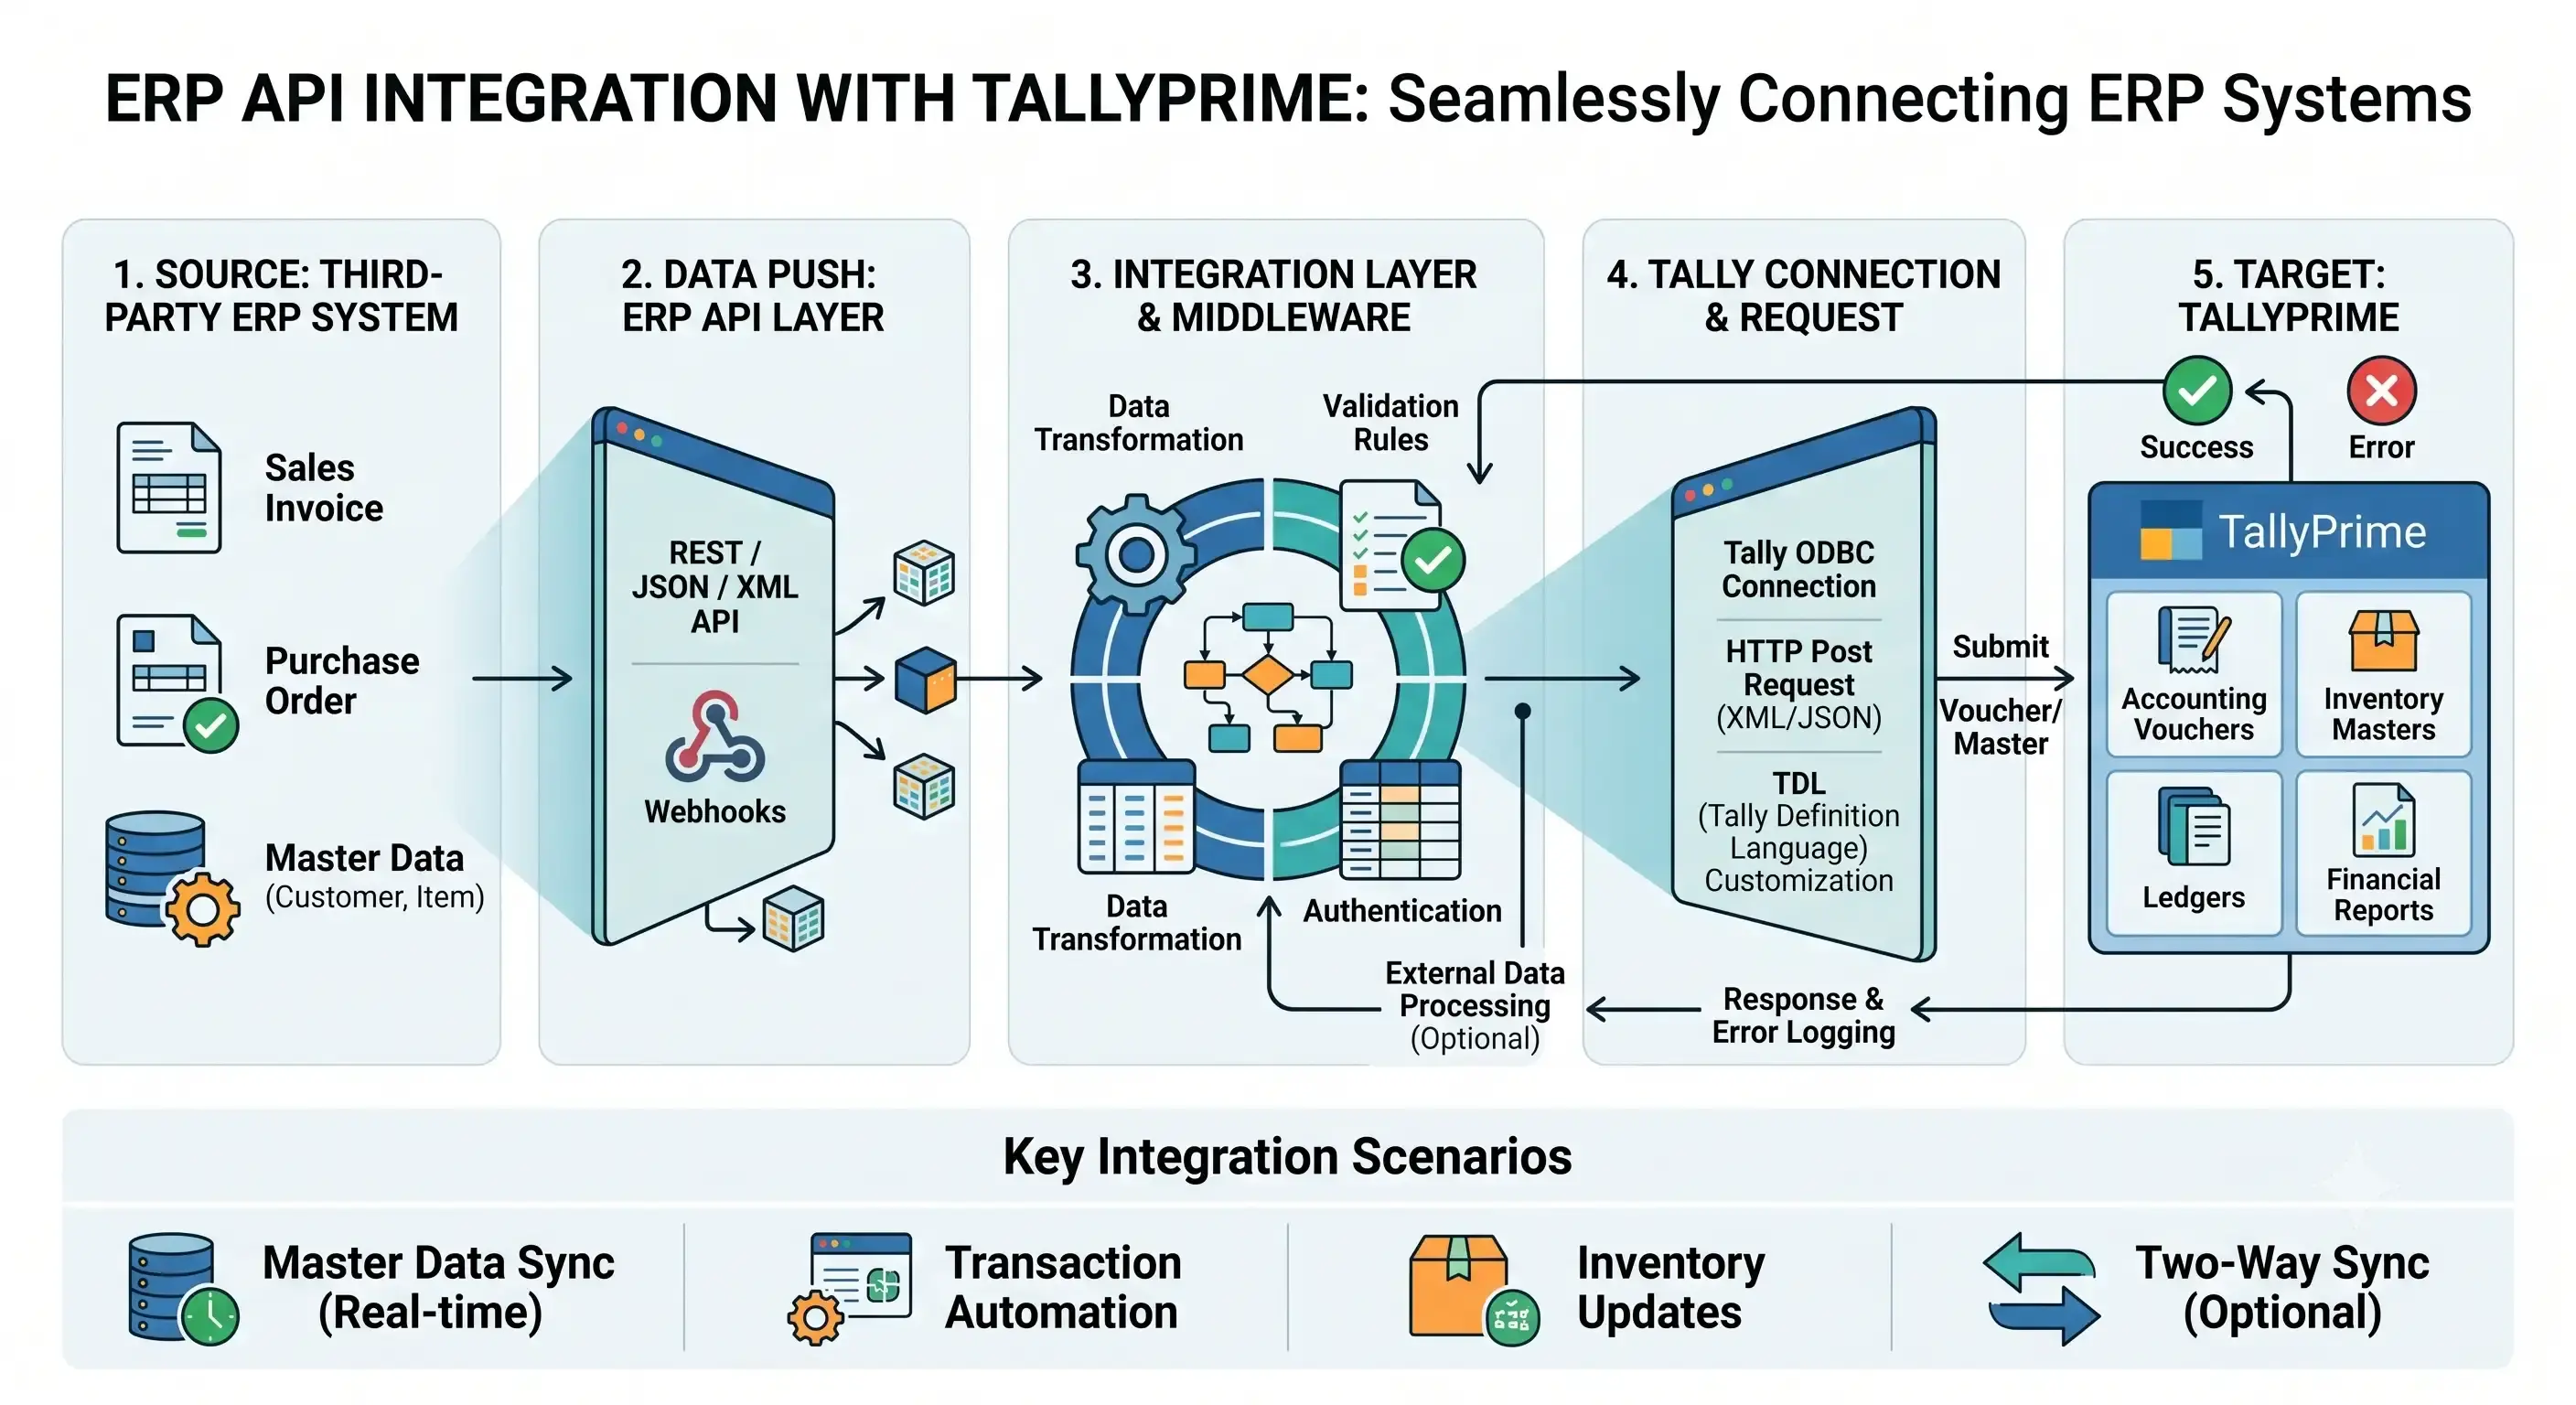
The exact reporting scope depends on the ERP/accounting setup. See our ERP API Integration with TallyPrimeguide.
Distributors
Distributors can analyze:
- Customer sales
- Product movement
- Outstanding
- Branch performance
- Purchase trends
Service Businesses
Service businesses may use reports for:
- Revenue
- Customer billing
- Outstanding
- Expenses
- Monthly performance
How to Automate TallyPrime Excel Reporting
A practical implementation can follow these steps.
Common Mistakes in TallyPrime Excel Automation
Excel vs Business Intelligence Dashboard
Excel remains useful for analysis, but businesses may eventually need more centralized reporting.
| Excel Reporting | BI Dashboard |
|---|---|
| Spreadsheet-based | Centralized visualization |
| Flexible analysis | Structured dashboards |
| Manual refresh may be required | Can be connected to data sources |
| Easy for small reports | Useful for broader reporting |
| Familiar to most teams | Designed for management visibility |
| File-based sharing | Centralized access can be configured |
The choice depends on business size, reporting complexity and existing systems.
For some businesses, Excel may be sufficient. For others, integrating TallyPrime with a centralized dashboard may be more suitable.
When Should You Automate TallyPrime and Excel?
Automation may be worth considering when:
- Reports are prepared repeatedly
- Large amounts of data are involved
- Multiple Excel files need consolidation
- Manual copy-paste takes significant time
- Management needs regular reports
- Reporting errors occur frequently
- Data comes from multiple business systems
If the report is prepared only occasionally and contains very little data, a complex integration may not be necessary.
TallyPrime + Excel + CRM
Businesses can also combine CRM and accounting information.
For example:
↓
Sales Information
↓
Integration
↓
TallyPrime
↓
Financial Data
↓
Excel / Dashboard
This can help create reports combining sales and accounting information.
For example:
- Sales pipeline vs actual sales
- Customer sales
- Invoice status
- Outstanding
- Revenue analysis
The exact integration depends on the CRM and business requirements. Learn more about CRM Integration with TallyPrime.
TallyPrime + Excel + E-commerce
For e-commerce businesses, the architecture can be expanded:
↓
Orders
↓
Integration
↓
TallyPrime
↓
Accounting Data
↓
Excel / Dashboard
This can create a broader reporting workflow covering online sales and accounting data. See our dedicated E-commerce Integration with TallyPrimeguide.
Benefits of TallyPrime Excel Integration
A properly designed workflow can help businesses:
Reduce Repetitive Work: Less manual copying and formatting.
Standardize Reports: Reports can follow a consistent structure.
Improve Data Visibility: Relevant information can be made easier to analyze.
Reduce Manual Errors: Validation and structured processing can reduce some manual mistakes.
Speed Up Reporting: Regular reports can be prepared more efficiently.
Support Better Decision-Making: Management can access structured information for analysis.
How Much Does TallyPrime Excel Integration Cost?
There is no fixed price for every business.
The cost can depend on:
- Reporting requirements
- Data volume
- Number of reports
- Integration method
- Customization
- Automation frequency
- Number of systems
- Data mapping
- Validation requirements
- Dashboard requirements
A simple reporting workflow will generally have different requirements from a multi-system business automation project.
Frequently Asked Questions
Can TallyPrime be integrated with Excel?
Yes, a workflow can be designed to transfer relevant data between TallyPrime and Excel depending on the reporting or automation requirement.
Can TallyPrime data be exported to Excel?
TallyPrime data can be used in Excel-based reporting workflows. The exact method depends on the required report and implementation.
Can Excel data be transferred to TallyPrime?
Structured Excel data can potentially be processed into TallyPrime through an appropriate integration workflow, subject to the required mapping and technical setup.
Can TallyPrime reports be automated in Excel?
Yes, recurring reporting workflows can be automated or streamlined depending on the data source, report structure and integration method.
Can TallyPrime and Excel be used for MIS reporting?
Yes. TallyPrime can provide relevant accounting/business data while Excel can be used for analysis and management reporting.
Can TallyPrime Excel integration reduce manual work?
Yes. A properly designed workflow can reduce repetitive export, copy-paste, formatting and consolidation activities.
Is Excel better than a business intelligence dashboard?
Neither is universally better. Excel is useful for flexible spreadsheet analysis, while BI dashboards can be useful when businesses need centralized and interactive reporting.
Can TallyPrime Excel integration include CRM data?
Yes, if the broader architecture connects CRM, TallyPrime and the reporting layer.
Conclusion
Excel is not going away from business reporting anytime soon.
The opportunity is to make the relationship between TallyPrime and Excel more structured.
Instead of repeatedly:
businesses can design a workflow such as:
or:
The right approach depends on the reporting requirements, data volume, systems involved and level of automation required.
If your team is spending significant time preparing repetitive Excel reports from TallyPrime, it may be worth evaluating a structured integration or reporting workflow.
Internal Linking Plan
| Context | Anchor Text | URL |
|---|---|---|
| Main CTA | TallyPrime Integration Services | /tallyprime-erp-integration |
| General integration | Tally Integration | /tally-integration |
| API section | Tally API Integration Services | /tally-api-integration-services |
| CRM section | CRM Integration with TallyPrime | /crm-integration-with-tallyprime |
| E-commerce section | E-commerce Integration with TallyPrime | /blog/ecommerce-integration-with-tallyprime |
| ERP section | ERP API Integration with TallyPrime | /blog/erp-api-integration-with-tallyprime |
| Dashboard section | Business Intelligence Tools in Dubai & UAE | /business-intelligence-tools-dubai |
Connect TallyPrime With Your Business Systems
Pragyantra works on TallyPrime integration, API integration, business automation and connected reporting workflows.
If you want to reduce repetitive Excel-based work and connect TallyPrime with your business systems, start by identifying the reports and workflows that currently require the most manual effort.
🏢 Pragyantra Solutions | Helpline: +91 77280 57558| Web: www.pragyantra.com