Instant Financial & Management Reporting:
From Raw Data to Boardroom-Ready MIS
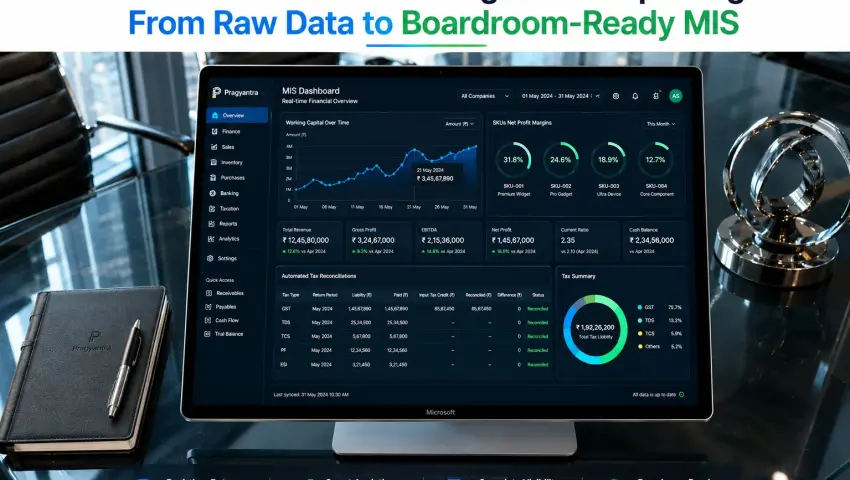
Stop waiting for month-end to know your profits. Generate accurate P&L, Balance Sheets, Cash Flow, and Sales Analytics in seconds—not hours. Pragyantra seamlessly pulls live data from Tally, Zoho, and your ERPs.
📊 The Pragyantra Reporting Benchmark⚡
100% Automated Extraction
0 Days Lost on Reconciliations
256-Bit AES Data Encryption
Real-Time Tally/Zoho API Sync
The "Month-End" Nightmare: Why Manual Reporting is Costing You Money
In the fast-paced business world, delayed data is dead data. If your management team is still relying on accountants to manually export data from Tally, copy it into Excel, and format MIS reports, you are operating in the dark.
- The Speed Gap: By the time you get the profit report on the 10th of the next month, it's too late to fix last month's operational leaks.
- The Accuracy Risk: Broken Excel formulas and manual data entry errors lead to flawed financial decisions.
- The Cash Flow Blindness: You cannot spot delayed receivables or sudden expense spikes until the cash is already gone.
Pragyantra’s Management Reporting Software eliminates this chaos. We act as your automated digital CFO, delivering real-time business analytics directly to your screen.
1. Core Capabilities: What Our Reporting Engine Delivers
📈 One-Click Financial Statements
Instantly generate your Profit & Loss (P&L), Balance Sheet, and Trial Balance. No manual tallying required. Your numbers are always tax-ready and 100% accurate.
💸 Live Cash Flow & Outstanding
Never lose track of your working capital. View real-time accounts receivable and payable. Set up automated alerts for invoices crossing the 90-day overdue mark.
📊 Granular Sales Analytics
Drill down into your revenue. View performance by department, branch, individual sales executive, or specific product line to instantly identify profit channels.
🤖 AI-Powered Anomaly Detection
Our system highlights risks. The software automatically flags unusual expense spikes or sudden drops in sales margins compared to your historical baseline data nodes.
2. Seamless Ecosystem Connectivity
Your reports are only as good as your data pipelines. Pragyantra’s API architecture pulls data seamlessly from your existing software stack without disrupting your team's day-to-day work:
3. Empowering Every Role in Your Organization
👑 For the CEO / Founder:
A high-level, visual snapshot of daily revenue, gross margins, and cash-in-hand to guide strategic market growth.
📊 For the CFO / Finance Head:
Deep-dive pivot tables, budget-vs-actual variance analysis, and instant GST/Tax compliance reporting structures.
⚙️ For the Department Heads:
Filtered views of team pipeline performance, departmental expenses, and localized sales validation targets.
💡 Ready to stop managing spreadsheets and start managing growth?
4. The ROI: Manual Excel vs. Pragyantra Automation
| Metric | The Old Way (Manual Excel) | With Pragyantra Reporting |
|---|---|---|
| Report Generation | 3 to 5 Days (End of Month) | Instant (On-Demand 24/7) |
| Data Accuracy | High risk of formula & entry errors | 100% System-Validated Integrity |
| Data Consolidation | Messy imports across 4 softwares | Unified in One Single Dashboard |
| Sharing & Exporting | Emailing heavy, outdated spreadsheet files | Live Links, PDF, Excel, or WhatsApp |